SSONʰG
2026
ETA: EU Trade Agent
ETA lets Korean steel exporters predict their EU CBAM costs and carbon intensity in seconds using just product/HS code, export country, and production route — powered by public GIR, DART, and customs data — then connects them to AI diagnostics and government support.

Overview
Turning CBAM Uncertainty into an Actionable First Estimate
ETA helps Korean steel exporters estimate potential CBAM costs, benchmark their carbon intensity, and identify appropriate next steps before investing in full emissions verification. It combines GIR emissions data, DART production records, customs pricing, and EU CBAM reference values to generate preliminary estimates based on product type, export destination, shipment volume, and production route.
The Impact
The platform transformed fragmented regulatory and public data into a practical decision-support workflow. By lowering the amount of information required for an initial assessment, ETA enables firms without established MRV systems to understand their potential exposure, compare their performance with industry and EU benchmarks, and move directly from risk identification to diagnostic reporting and relevant government or consulting support.
Problem
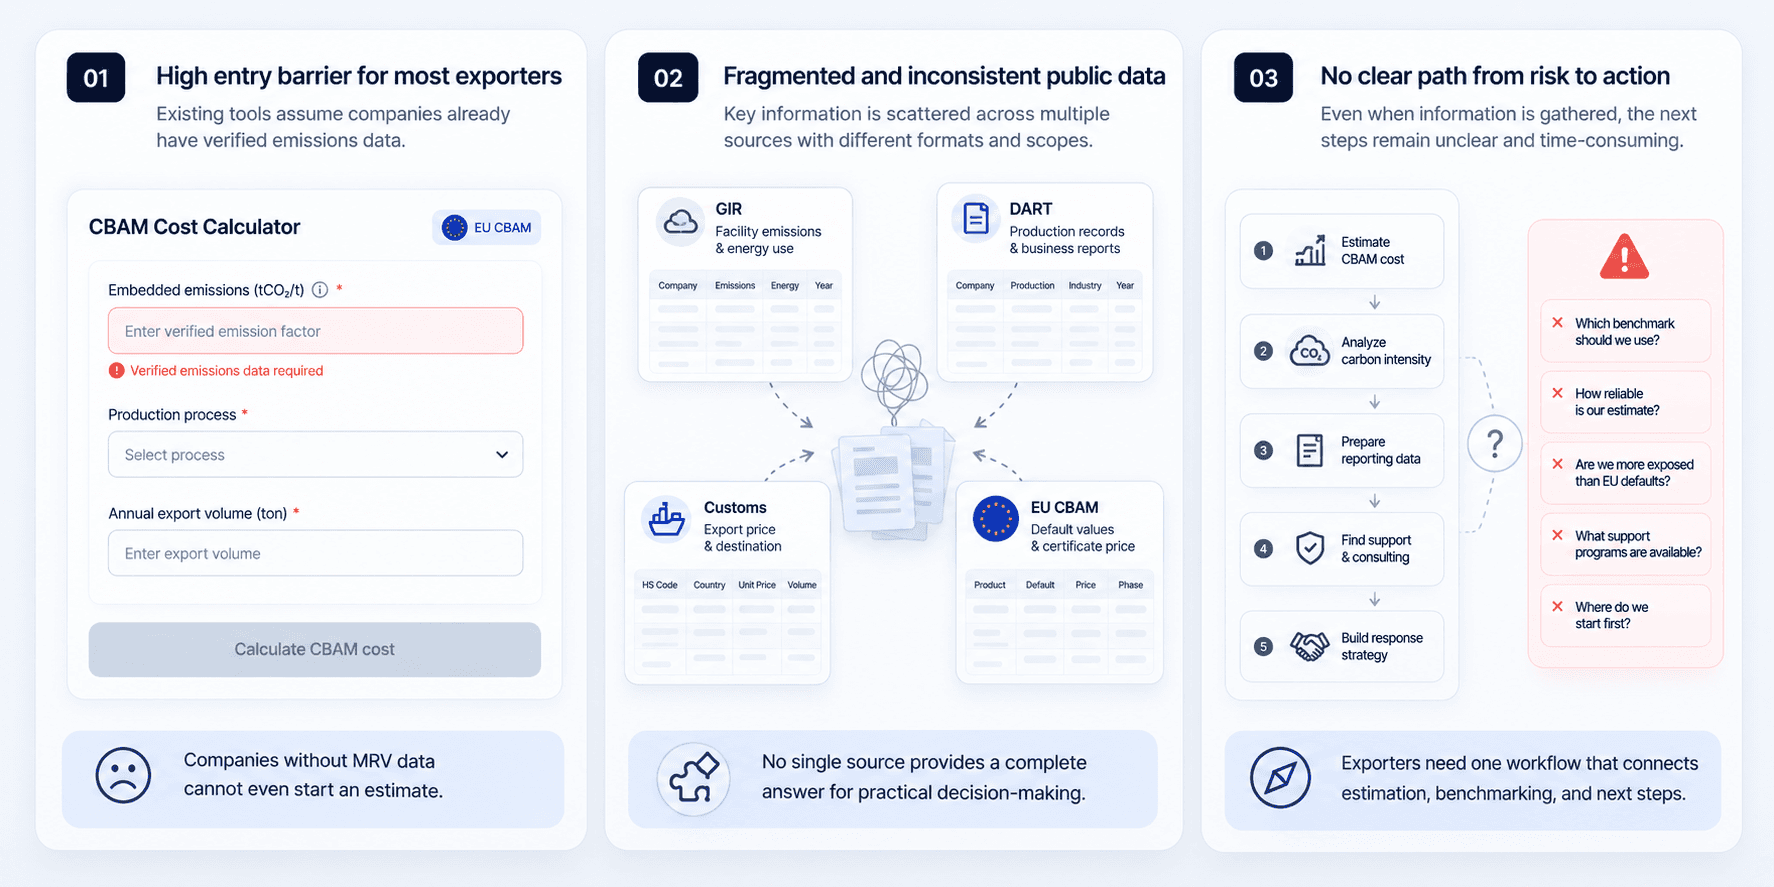
CBAM tools assumed companies already had the data they were trying to obtain
Many Korean steel exporters—particularly SMEs outside formal emissions reporting systems—lacked verified product-level emissions data, dedicated compliance teams, and the resources to commission an assessment before understanding the scale of their risk.
Existing CBAM tools often required users to enter their own embedded emissions or verified MRV data. This created a circular barrier: companies needed emissions data to estimate their CBAM exposure, but needed an initial estimate before deciding whether measurement and verification were worth the cost.
At the same time, the information needed to build a preliminary estimate was scattered across GIR emissions records, DART production disclosures, customs data, and EU reference values. Exporters had no clear way to connect these sources, compare their production route with relevant benchmarks, or translate a cost estimate into practical next steps.
Research
Testing whether public data could support a credible CBAM estimate
I began by mapping the full CBAM decision process—from estimating embedded emissions and comparing EU default values to purchasing certificates and identifying appropriate support. I reviewed the regulation, existing compliance tools, and the information available to Korean steel exporters to understand where companies without verified product-level emissions data were most likely to encounter barriers.
I then audited and connected four core data sources: GIR facility-level emissions and energy records, DART production disclosures, Korea Customs Service trade and pricing data, and EU CBAM reference values. The datasets were standardized by company, year, and production route to examine whether fragmented public records could be translated into a usable preliminary estimate.
To validate the methodology, I calculated carbon intensity for six major Korean steel producers and compared the results with company-disclosed figures. The estimates aligned closely—for example, the calculated intensity for POSCO was 2.06 tCO₂/t, compared with its disclosed value of 2.05. The analysis also revealed consistent clustering by production route, particularly among electric arc furnace producers, supporting the use of peer-based reference classes when company-specific MRV data is unavailable.
What we learned
The primary constraint was not the complete absence of data, but the lack of an integrated structure. Relevant information existed across multiple public systems, yet differences in company names, reporting units, years, and organizational boundaries made direct comparison difficult. Reliable estimation therefore required careful standardization, source reconciliation, and transparent assumptions.
The research also showed that production route is a strong predictor of carbon intensity. Blast furnace, mixed-route, and electric arc furnace producers formed distinct ranges, making it possible to generate bounded preliminary estimates even when detailed product-level emissions are unavailable. This finding shaped ETA’s core workflow: begin with a low-barrier estimate, show the benchmark and uncertainty behind it, and guide the user toward verification or support based on the resulting risk level.
Data Architecture
Building a traceable data pipeline for CBAM estimation
Based on the research findings, I translated fragmented public records into a structured data architecture that could support repeatable and explainable CBAM estimates. The system connects GIR emissions and allowance records, DART production disclosures, customs pricing data, and EU CBAM reference values through standardized company names, reporting years, product categories, and production routes.
The architecture was organized into five layers: source ingestion, entity and unit standardization, production-route classification, carbon-intensity and cost calculation, and decision-support outputs. Each calculated value retains its underlying source, reference year, and assumption so users can distinguish between company-specific evidence, peer-based estimates, and EU default values.
This structure allows the same integrated dataset to power multiple features across ETA—including preliminary cost screening, carbon-intensity benchmarking, market analysis, scenario comparison, and AI-generated diagnostic reports. More importantly, it makes the estimate auditable: users can see not only the result, but also how the data was connected and where uncertainty remains.

Development
Building an end-to-end CBAM workflow from screening to action
I developed ETA as a connected decision-support workflow rather than a collection of isolated dashboards. The platform guides users from a low-barrier CBAM cost estimate to a diagnostic report, production-route benchmarking, market context, and relevant support options.
Each module uses the same integrated data layer, allowing user inputs, public records, reference values, and calculation assumptions to remain consistent across the experience. The interface was designed to progressively reveal more detail: users first receive a clear estimate, then inspect the evidence behind it and decide whether to pursue verification, operational improvements, or external support.
CBAM Cost Screening
Users begin by selecting a company or entering basic export information, including the product or HS code, EU destination, annual export volume, production model, and carbon-price assumptions. When a registered company is selected, ETA automatically applies the relevant production route and available public data. The results panel updates the estimated annual CBAM cost, calculation range, direct carbon intensity, price impact, and exposure level. A multi-year scenario view also shows how costs may change as CBAM implementation progresses.
AI Diagnostic Report
After completing the screening, users can generate a structured diagnostic report based on their inputs and the platform’s integrated dataset. The report summarizes the estimated cost, applied production route, carbon intensity, price assumptions, and overall exposure level. It also explains the result in practical terms, provides recommended responses, and organizes the underlying evidence into a document that can be saved or printed for internal review and decision-making.
Support and Consulting Matching
ETA connects the diagnostic result to relevant government programs and consulting services. Users enter an available budget, and the platform prioritizes free public support before recommending paid providers that match the company’s needs. Each option includes its service focus, estimated cost, and support category, helping users move directly from risk identification to verification, MRV development, data preparation, or broader CBAM advisory support.
Carbon-Intensity Benchmarking
The benchmarking module compares the company’s estimated direct carbon intensity with production-route peers and applicable EU default values. This allows users to understand whether their emissions performance represents a cost disadvantage or a potential negotiation advantage. A detailed validation table shows how emissions, production volume, direct-emissions ratios, and reference values were used to calculate each benchmark, making the methodology transparent and reviewable.
Company Database
The company database provides a searchable and filterable view of Korean steel producers included in the integrated dataset. Users can explore production routes, verified emissions, energy use, carbon intensity, allowance status, allocation volumes, and facility locations. This module supports company-level investigation and enables users to identify comparable firms before interpreting their own screening or benchmark results.
Market Overview
The market overview aggregates company-level data into broader industry insights. Summary indicators present the number of analyzed firms, total emissions, production-route characteristics, and allowance exposure. Interactive charts show major emitters, production-route distribution, emissions relative to allocated allowances, and historical industry trends. This places an individual company’s estimate within the wider structure of the Korean steel sector.
Lessons
Designing estimates that are useful without overstating certainty
This project reinforced that the value of a decision-support tool does not come from producing a single precise-looking number. It comes from helping users understand how the estimate was produced, which data was used, and where uncertainty remains. For companies without verified emissions data, a transparent range with clear assumptions is more useful than an unexplained result presented as definitive.
A second lesson was that public data becomes valuable only after significant reconciliation. Company names, reporting years, organizational boundaries, production units, and process classifications differed across GIR, DART, customs, and EU datasets. Building ETA therefore required not only calculation logic, but also a traceable structure that preserved source provenance and made each transformation reviewable.
The project also showed that an initial estimate should lead directly to action. Cost screening alone does not tell an exporter whether to verify its emissions, challenge an EU default value, improve its production process, or seek external support. Connecting the estimate to benchmarks, diagnostic explanations, and relevant support options made the platform more practical for organizations with limited internal capacity.
Ultimately, ETA taught me to treat uncertainty as a design requirement rather than a weakness. A responsible tool should clearly distinguish verified company data, peer-based estimates, and regulatory defaults—while giving users enough context to make a better next decision.


